44 Million Credit Downgrades
The impact of ending the federal student debt pause on credit access
In 2020 governments around the world made unprecedented choices in the face of a global pandemic. And the U.S. is poised to unwind one of those choices this summer - the pause in student loan repayments. What does this change mean?
First, let’s put the size of the change in context. 44 million borrowers have federal student loan debt, with an average balance of $39,000 and an average monthly payment of $3931. As you might expect, these borrowers skew younger (median age 33) and have lower credit scores (median 6542).
When the forbearance pause began, it affected paydown behavior across the board. Nearly 80% of borrowers weren’t paying down balances once the payments pause began. So how are those borrowers positioned in 2023 when the payments re-start?
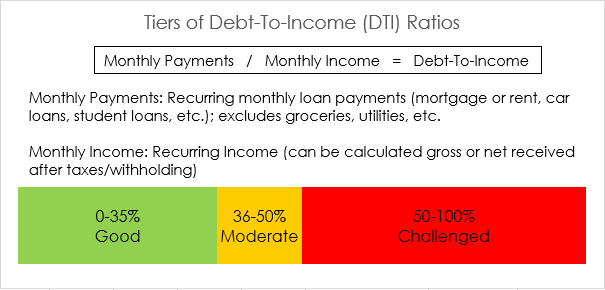
First, let’s understand how many lenders look at a borrower’s financial health - their debt-to-income (DTI) ratio. While this isn’t the only factor included in the decision, it is a primary tool for many credit underwriters.
Borrowers with debt-to-income ratios of 35% or below have easy access to credit. Borrowers at 50% or above will generally struggle to access credit, with everything in between subject to the individual lender.
So, for someone making $50,000 a year3, the average monthly student loan payment would be a little over 9% of their monthly gross income. Let’s factor in that borrower’s other monthly payments in relation to income:
Median one-bedroom rent payment of $1,4954 (36% of income)
Used car monthly payment of $5265 (13% of income)
So, when student loan payments resume, a borrower paying the median one-bedroom rent will have a 45% debt-to-income ratio. For a borrower with a one-bedroom rent and a used car payment, their debt-to-income jumps to 58%. These borrowers do not present the kind of metrics that lenders typically approve for loans.
Notice this analysis doesn’t use the actual monthly income that comes to the borrower net of taxes and withholding. It doesn’t include the recent impact of inflation on the cost of everyday goods and services. And it doesn’t include the burden of any other debt payments, from buy-now-pay-later to medical debt. In all likelihood, this analysis under-states the level of financial stress.
We know financial institutions are less interested in making “risky” loans today than they were a year ago. And at some point in 2023, there are 44 million people that will look riskier to lenders than they did a year ago. If we already know that millions of people struggle to pay an unexpected $400 expense6 before the student loan pause ends, the headlines shouldn’t distract us from reality - a lot of people are going to struggle making ends meet in the next year. And the financial institutions that serve them may need to look beyond traditional tools if they want to help.
https://thecollegeinvestor.com/33643/average-student-loan-monthly-payment/
https://libertystreeteconomics.newyorkfed.org/2022/03/student-loan-repayment-during-the-pandemic-forbearance/
https://www.census.gov/library/publications/2022/demo/p60-276.html
https://www.zumper.com/blog/rental-price-data/
https://www.nerdwallet.com/article/loans/auto-loans/average-monthly-car-payment#:~:text=Here%20is%20a%20list%20of,here's%20how%20we%20make%20money.&text=The%20average%20monthly%20car%20loan,to%20credit%20reporting%20agency%20Experian.
https://www.federalreserve.gov/publications/files/2022-report-economic-well-being-us-households-202305.pdf


